Indicatorless Forex trading. A simple indicator-free Forex strategy
First, let's laugh a little. Sometimes it makes me laugh when on some forum people post screenshots of their work schedule, but the schedule itself is not visible. It has everything: trend lines, a whole bunch of indicators, some notes, but the main thing is not visible, the price.
If you think that I greatly exaggerated with the installation of indicators, then you are mistaken. Now I don’t want to look, and I’m unlikely to find it, but I saw a similar picture on a forum, where people carefully explained why the market should go in one direction or another.
At such moments, wild curiosity awakens and the desire to ask: " What do you even see on this graph? How can you analyze a price that is not visible?"
And besides, the irony is that very often the trader does not even know how this or that indicator works. Why does it even occur to a trader to use a bunch of incomprehensible indicators?
I guess it all starts with reading books. Many authors like to talk about this or that magic indicator, describe how it is great at trading using its signals, but the trouble is that if the author uses indicators, then at a certain time and for certain purposes.
What does a trader do? He installs all the indicators he has ever heard of and begins to look for imaginary signals to enter a trade. The result is a drain on the deposit.
And yet, let's think, why does a trader have a burning desire to analyze the market using indicators? There will be two answers:
- it’s easier to analyze this way;
- There is no other way to understand market movement.
If the first answer can be questioned: what is easier is not always better; I have to agree with the second answer. I personally know people who sincerely admit that although they trade in the Forex market, they have no understanding of what is happening and who is in the market (bulls or bears).
For this reason, a bunch of indicators are installed, one might say for psychological support, but this is not necessary, since the market can be analyzed much easier and more correctly. I suggest removing all indicators, leaving only the price, and analyzing it.
Description of a non-indicator countertrend strategy
It is very important for a trader to know where the market is currently heading (up-trend or down-trend). To determine this, you need to correctly draw a trend line (I wrote about this in the article above) and the more often the price bounces from the marked level, the stronger the trend is considered.
Let me give you an example.

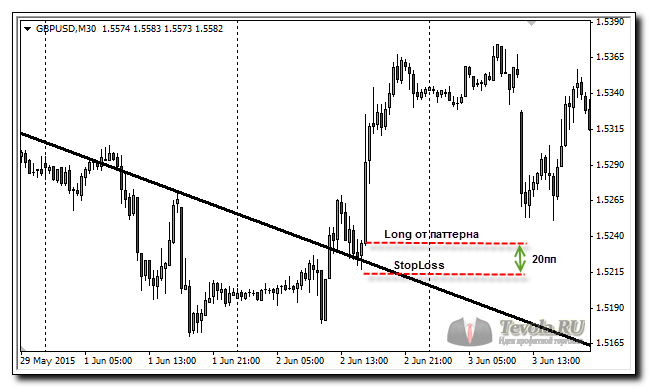
The screenshot shows that the price has already bounced off the trend line 4 times and we have every reason to believe that the downward trend will continue.
Now follow the thought. The idea of the strategy is as follows: since the price moves in any direction, relying on or pushing away from the trend line, it means that as soon as this level is broken, we can assume that the direction of the trend has changed.

Let's get down to specifics.
Entry point for a non-indicator countertrend strategy
Having analyzed the already available information, we must conclude that the first step is to find an established trend and draw a trend line. Then we move to the waiting stage and monitor the breakout of the existing line.
FOR INFO!!
As soon as a candle closes above a descending trend line, or below an ascending trend line, such a trend line is considered broken.

After the candle closes above the trend line, we wait for a retest of the broken line and enter long.
The idea is not new and I often see similar entries from traders (you can get acquainted with a huge number of such ideas in the category: ), but their system allows you to open a long position as soon as the price touches the broken line. In my opinion this is not the most best way entrance.
Where is the guarantee that this was not a false breakout? What if the retest is not exactly perfect, but much deeper than the line?
These questions tormented me for the time being until I came up with a filter. In my presentation of the strategy, we should look for an entry point near the broken trend line, which does not mean a specific point, but a certain area.
See how it worked in our example:

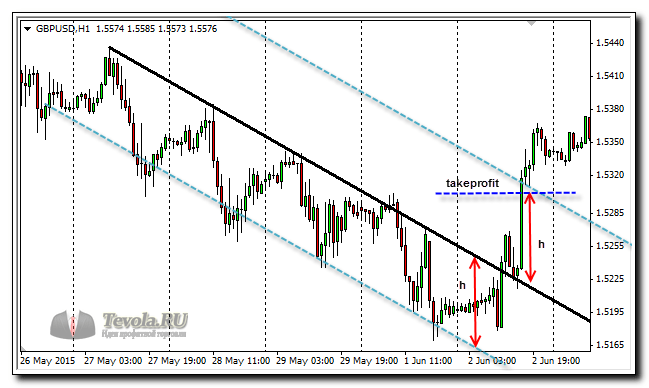
Having determined the breakout on the H1 timeframe, we wait for a retest of the broken line. As soon as the price approaches the target point, we begin to look for some pattern that confirms our intentions.
In this case, exactly on the broken trend line, we can detect a reversal candlestick analysis pattern, Bullish Engulfing. Of course, this model is not formed entirely correctly, but taking into account all the factors, you can take a risk and open a long position.
Placement of StopLoss using a non-indicator countertrend strategy
Finding a reversal pattern is not a fool's errand. It is important for us to get the right pattern in the right place, only in this way will the long signal strengthen and StopLoss decrease.
I will give two more pictures in which I show how to set the stop correctly:
- in the first case, we enter immediately after the retest of the broken line, stoploss will have to be removed behind the nearest Low, and this is 50 pp from the entry point.

- in the second case, we will go from the pattern. in this situation, stoploss can be placed behind the Low of the pattern, which will be 20pp. Yes, we missed 10 points and didn’t enter according to the most best price, but our stop was reduced by more than 2 times.
FOOTNOTE!!
Please note that in the article I write “entry from a pattern”, because it doesn’t matter at all which candlestick analysis figure will signal us.
We sorted out the stop, but one more question remains open: " When is the long signal cancelled?"
The long signal will be canceled only if the price returns back below the trend line and does not consolidate below it. Otherwise, if the first entry is stopped out, I will look for the next reversal pattern to enter long and open the trade again.
Placement of TakeProfit using a non-indicator countertrend strategy
With takeprofit, everything is much more complicated. Not because the calculation is too complicated, but because there are too many options. Some people like to let profits flow, others want to place orders and forget about the position.
I don’t have an exact answer that will satisfy both sides, but I can offer a few of my own ideas.
TakeProfit 1 to nth number
Everyone's favorite takeprofit, calculated from the ratio of stop to profit. The coefficient is different for everyone, the most common case is: 1 to 3, which means a stop at 10 pp, we set a profit of 30 pp.
TakeProfit equal to the channel width
There is an opinion that after breaking through the trend line, the price will travel a distance equal to the previous channel. Based on this, we can assume the following:
TakeProfit + TrailingStop
TrailingStop can be installed in different ways. Some trading terminals have a built-in trailing function by default.
I propose a slightly different trailing, which will need to be moved to Low (in the case of an uptrend) upon the close of the previous candle. With a good, high-quality trend, such an approach can bring good profits.
Conclusion
To summarize all of the above, we should note that it is possible to trade profitably without indicators. A lot of indicator-free trading strategies have been invented, and one of them is the one I introduced you to today, indicator-free countertrend strategy.
Let us repeat the important points of the strategy:
- We are looking for a strong trend.
- We are waiting for it to break through and consolidate above/below the trend line.
- We wait for the retest and select the detection area for the patterns of interest.
- Open a position based on the pattern.
- Set stoploss above/below the pattern.
- We calculate TakeProfit from the options proposed above.
This strategy works great on all timeframes. I didn’t litter the article with a bunch of screenshots, because you can always check the functionality yourself.
I guess that's all. Good luck to all of us in trading. Until next time.
Indicatorless trading is a style of trading on the Forex currency market that almost all novice traders want to master. Beginners are confident that experienced traders do not use indicators at all. There is some truth to this statement, since many indicators produce signals with a delay, which makes their use useless.
Non-indicator trading methods include candlestick analysis, as well as. Candlestick analysis is also called price action trading, but the essence of trading is the same. I would like to immediately note that indicator-free trading can be used in any market, both on Forex and on the stock market.
Description of non-indicator trading
Indicatorless Forex trading involves analyzing price behavior, as well as identifying waves and candlestick patterns, which can be either single-bar or in the form of several combinations of candlesticks. For price action trading, you can use an indicator as an assistant to identify candlestick patterns. By the term “indicators” we mean special algorithms that display suitable points for entering and exiting the market.
The category of indicator-free trading also includes trading based on fundamental analysis, as well as grid trading and locking. The main difference between indicator-free trading and trading using indicators is that in the second case, the trader receives signals from instruments that have a more psychotherapeutic effect. In reality, tools such as moving averages are not particularly useful.
Trading based on harmonic patterns is also indicator-free. Harmonic patterns are figures such as the Hartley Butterfly, the Bat, and so on.  In such a situation, trading comes down to identifying the relationships between the waves on the price chart. By carefully identifying where to enter the market, a trader can create a successful trade. Some traders who use this style of trading manage to earn more than 300 percent per year.
Non-Indicator Trading Styles
Unfortunately, indicators squeeze speculators into a narrow framework. It often happens that a price reversal is already visible visually on the chart, but the indicator still has not issued a signal to open a trade, as a result of which the trader misses the opportunity to make good money. Today, a lot of different trading techniques have been created, with the help of which it is possible to open transactions at the very beginning of a trend. Using these methods, profits are significantly increased and losses are reduced.
 I bring to your attention a few quite effective ways trading without using indicators:
- Grid trading. This trading method is intended for those speculators who can boast of a large initial sum of money. The profitability of such trading is 15 percent per month, but this income is quite enough to make a good capital. This trading method involves launching an advisor that creates a whole grid of orders. Previously, I have already described a large number of such robots, you can find them here.
- Swap strategies. This style of trading is most suitable for investors, as well as for those people who want to protect their savings from inflation. This trading method involves opening a grid of orders on the Australian dollar/US dollar pair every 100 points. Important: you only need to open buy trades. The profitability of this trading method is up to 15 percent per year.
- Hedging-based strategies. By creating trades in different directions on two pairs that are correlated with each other, you don’t have to worry about the occurrence of a drawdown, since it simply won’t happen. This trading technique is often used on euro/dollar, pound/dollar, dollar/franc pairs. The best results can be achieved if you buy the euro in the short term and sell the pound in the medium term. As a result of this, you will make a profit from two pairs with almost no risk of drawdown.
Strengths and weaknesses of indicator-less trading
Indicator-less trading provides the opportunity to create transactions at the very beginning of a trend, while indicator strategies provide signals with a delay. If, for example, you install an MA with a period of 14 on the chart, you will notice that the signals arrive with a very significant delay, in some cases this is as much as 10 bars. If the market is not very active, then such a delay is not strongly felt, but if the market sharply changes its direction from downward to upward and vice versa, then it will be too late to enter based on such signals.
 Indicator-less trading, if used correctly, can provide income of up to 100 pips without any significant drawdowns. Thus, an optimal ratio of potential income to the level of risks is ensured.
 It should be noted that indicator trading techniques also have their own advantages, including:
- The ability to entrust the assessment of the market situation to specialized tools.
- The ability to confirm the accuracy of received signals for opening positions using additional tools.
- The ability to systematize the process of creating positions.
Each trader must decide for himself which trading strategy to choose: indicator or non-indicator. But regardless of the choice of trading methodology, to ensure the safety of the trading process, it is recommended to comply with money management standards.
Currently exists huge amount a variety of indicator-free methods for creating positions, among which the most popular are:
- Trading techniques based on technical, candlestick or wave analysis.
- Strategies based on fundamental analysis, as well as analysis of harmonic figures.
Nowadays, any experienced trader uses a lot of different indicators to trade Forex, which help identify successful moments for entering the market. Many beginners, when starting trading with indicators, get carried away and forget to monitor the price line itself. There is only one way out of this situation – the use of indicator-free strategies. Home distinctive feature The advantage of these strategies is that they are easy to learn and highly profitable. Any indicator-free Forex strategy is based on certain rules, if followed, you can achieve good profits.
What is a no-indicator strategy
A non-indicator strategy is visual analysis movement of a trend, which is based on logic and competent decision-making. This strategy is perfect for those who doubt the reliable forecasts of indicators.
Nowadays, there are a large number of indicator-free strategies, which we will talk about today.
Non-indicator strategy based on the use of pending orders
This strategy is perfect for both experienced traders and beginners. It is based on visual inspection price movements and determining cost levels. It is recommended to enter the market as soon as the price overcomes a given level. You can use this strategy on any Forex market instrument. The main thing is to make a discovery on time.
This strategy is great for trading during small price changes when the market is trending horizontally. The rate should change within 10 points. In this case, traders wait for news to appear, after which a sharp jump in price should occur. The main task of a trader is to determine the direction of the jump.
General characteristics:
- The right timing for trading. A large number of traders make the serious mistake of trying to trade the market when it is convenient for them, rather than when the market is in a good position.
- can be very different. People experienced in this matter advise choosing a small brokerage firm.
So, we select a currency pair with a trend, which is located in the side corridor (flat). If there is no such currency pair at the moment, then it is better to wait a little and wait for a more opportune moment. The indicator-free Forex strategies, the videos of which are presented below, are very easy to use and highly effective.
Entering the market
As stated earlier, this strategy is based on discovery. To open an order, we perform the following actions: find the “New Order” section, click on it, click add and select the appropriate type - pending.
Experienced traders advise placing a sell order in the event of a sharp upward price jump, and a buy order in the event of a downward jump. Don’t forget also about the need to set “Stop Loss” and “Take Profit”.
"Three Candles"
This strategy is perfect for those traders who cannot often be in front of a screen, but devote several hours a day to the market. To use this strategy, there is no need to use a large number of indicators. To use it, it is enough to be able to analyze candles. Thanks to this, the strategy becomes extremely easy to use. It is recommended to use it during the daytime.
How to enter a purchase correctly:
- Select a currency pair and time frame D1.
- We analyze the market for the previous 3 days, and if today it is higher than in previous days, then you can make a purchase. The main thing is that all 3 candles are bullish.
- The stop loss must be set several points lower than the minimum price of the previous day.
- It is necessary to fix income gradually. First, the profit must be taken as soon as the price rises by 30 points, after which you can set “Take Profit” to 100 points.
To open a “Sell” order, all actions must be performed exactly the opposite. The main difference is that the price of the previous days should increase, and all 3 consecutive candles should gradually decrease. “Stop Loss” is set very close to the maximum value of the previous candle. Income is also withdrawn in stages.
The main advantage of this strategy is that a person does not need to constantly monitor the market, since this trading principle eliminates all the risks of unsuccessful entry into the market.
Indicator-free simple strategy “80-20”
This is another non-indicator simple strategy forex, the creator of which is L.B. Raschke. It is very simple and effective.
Prerequisites:
- It is recommended to trade using this strategy during the daytime.
- Currency pairs can be very different.
The basis of the 80-20 strategy is as follows: if a candle was opened and closed at the 20% limit of the D1 chart, then with a 90% probability it will continue to move towards the close of the day. In other words, there is a possibility of a complete trend reversal, which is exactly what we need.
 The candle, indicated in green in the figure, perfectly meets all these conditions.
 To enter the market to buy, the following conditions must be met:
- The price should be below the previous day's low. A price reduction of 20 points is quite enough.
- If the trend is already less than yesterday’s level, then you can open a pending buy order with the level of the minimum value of the previous day.
- “Stop Loss” must be set several points below the current minimum.
If you need to open a “Sell” order, then all the steps described above are performed exactly the opposite. Similar signals very rarely appear on the price chart; in this regard, it is best to use several currency pairs at the same time.
Almost all non-indicator Forex trading strategies are closed using set stop losses. In very rare cases, there is an opportunity to exit the market before the established stops are triggered.
Today I will tell you about another indicator-free Forex strategy. This strategy, despite the fact that it does not involve the use of indicators, brings good profits.
The indicator-free Forex strategy is easy to use, so I advise all newcomers to the Forex market to take a closer look at it. Traditionally, it is not recommended to trade intraday using this strategy before the exit and within 30 minutes after the publication of important economic news.
Description of a non-indicator trading strategy
The indicator-free Forex strategy is suitable for use on any currency pair. To work using this method of opening orders, you need to use 4 time frames at once: H1, M30, M15 and M5.
After the hourly bar closes, the speculator should pay attention to its shade. The next picture shows that at 11 am a good ascending bar closed, therefore, we will consider opening a buy trade.
After this, you need to open a shorter time interval, namely 30 minutes, and see which candle formed in the period from 10.30 to 11.00.
 In our example, an upward candle was also formed, which confirms the strength of the bulls. Next, we need to go to the 15-minute chart and see which bar closed at 11 o’clock. In our example, a green candle also appeared on the 15-minute chart.
 The 15-minute chart also confirmed to us that the bulls are winning the market. Then you can switch to the five-minute chart.
 On the 5-minute chart we also see a green candle, which means that buyers are dominating at the moment and we can safely open a buy order.
Setting stop and take
A non-indicator Forex strategy involves setting a stop in two ways:
- Stop can be placed at a distance of 15 points from the market entry point.
- The stop can be placed behind the last fractal on the 5-minute chart.
 In the example under consideration, it can be seen that Take-Profit of 30 points was achieved on the 20th bar after opening the deal. Also note that if we placed a stop near the last fractal, then our losses would be less if the situation developed according to an unfavorable scenario for us.
I am not at all encouraging you to set a stop near the fractal, I just drew your attention to the moment. Each method of setting stops has its pros and cons, and which one to choose is up to you.
Conditions for opening sell orders
Now let's look at an example of creating a sell position using this strategy. First, we look at the hourly chart, we see that the red candle closed at 11 o’clock.
 Next, we move to the M30 time interval and see that the red bar has closed there too.
 On the 15-minute chart we also see a red candle.
 A red candle also appeared on the five-minute chart, which confirms the dominance of bears in the market. In such a situation, you can safely open a sell transaction.
 In our example, the trade would be successful and would bring us 30 points of profit.
Features of identifying signals for entering the market
Above were examples of ideal signals. I would like to immediately note that such signals do not happen rarely, so we did not have to look for suitable moments in history for a long time. It should be noted that ideal conditions are not always observed, but, nevertheless, the signals can be of high quality.
Let's take a look possible deviations, in which you should not refuse to open a deal. Let’s say that on the hourly and 30-minute charts the direction is the same, but on the 5-minute and 15-minute charts candles of a different direction appeared, such signals do not need to be ignored, you can continue to monitor the chart. If within three candles the desired bar appears on the 15-minute chart, then you can safely create a position.
This rule also applies to M5 time intervals; if everything is fine on the senior charts, then the M5 time interval can be observed for an hour.
In order not to constantly switch charts, you can immediately open 4 charts in the trading platform. You can see an example in the following picture.
 This is very easy to do: just visit the “Window” menu, which is located on the top panel. Next, you need to select the “Vertical” option, and then arrange all 4 graphs in a manner convenient for you.
 There is a small trick that allows you to increase your potential profit, even though the position creation technique we are discussing assumes a fixed income of 30 pips. To increase the size of your potential profit, you should use a floating trail, the size of which you should choose yourself in accordance with the currency pair used, as well as the situation that developed on the market during trading.
There are situations when the price level, having approached closely to Take-Profit, changes the direction of its movement, as a result of which the active order is closed by Stop-Loss and brings a loss. Such situations can be avoided if you follow the recommendations of professional speculators.
At the moment when the price level passes 15 pips in the desired direction, you need to move the active position to a break-even position. This way, if the price level suddenly changes directions, your profit will still be 15 pips.
Some speculators, when using the order opening technique we are considering, initially use a Take-Profit of 15 pips. This approach to trading allows you to quickly take profits and begin searching for a suitable place to conclude a new deal.
To learn how to correctly enter into transactions in accordance with the rules of this trading technique, you should practice on a demo account. You can start trading with real money only after you have acquired the necessary skills in applying this strategy.
Trading without indicators has recently become increasingly popular both among professional Forex market speculators and novice traders. The editors of TradeHow have compiled recommendations on how best to use such trading systems.
TOP 3 Forex brokers in the world:
The strategy, of course, will no longer be indicator-free, since it still uses one indicator, but if we discard this convention, then with its help you can obtain a fairly reliable, although not ultra-precise, method of entering the market at price extremes.
You can trade at extremes both intraday and on longer time intervals with almost any financial instrument. You can use pairs with medium and high volatility:
- NZD/USD;
- EUR/USD;
- GBP/USD.
Let's consider the strategy using the example of the New Zealand dollar on a fifteen-minute timeframe. You should buy a currency from the bottom point of the Zig-Zag and sell it at its top point with a stop, respectively, above or below these extreme quote values.
The disadvantage of the strategy is that for the next extreme to form, at least two candles must form after it. Sometimes during these two candles the price manages to travel a considerable distance along the new trend, and the trader loses possible profits, but entering positions earlier is too risky.
In addition, the trend reversal may turn out to be false, and the price may again turn in the direction of the newly formed extreme and update it. Therefore, each trade must be protected with a tight stop loss. If the reversal turns out to be correct and a new trend is forming, then you can keep the deal open longer by moving the stop loss or using trailing.
Forex strategies without indicators based on candle shadows
This method of indicator-free trading can be considered a special case of candlestick analysis. As chart observations show, at the moment of trend exhaustion, Japanese candlesticks in the upper and lower areas of the price chart begin to “cast” long shadows. This is due to the indecisiveness of market participants.
When the trend reaches a local extremum, a zone of accumulation of such candles is formed. The price reaches the extreme of the previous candle, then it cannot overcome this level and then moves in the direction where the body of the candle is directed. As a result, on the chart, these extreme shadow points indicate levels of resistance to the old trend and support for the new trend.
An example of trading using candle shadows on the weekly chart of the EUR/USD pair.
These types of candlestick clusters are clearly visible on the weekly chart of the EUR/USD pair. As can be seen from the example, trades need to be opened in the direction opposite to the long shadows.
Indicator-free Forex strategy using technical analysis figures
A careful study of the chart of absolutely any financial instrument allows us to identify consolidation zones of price accumulations on it. In such areas, the price fluctuates between local extremes with relatively low volatility without breakouts up or down. If in such areas you connect the points of local extreme price values with segments, you can get a certain figure of graphical analysis or a graphical pattern.
If a pattern appears at the beginning or end of an ongoing trend, then a reversal is highly likely to be expected. The most common, frequently repeated reversal patterns include the following:
- double, triple bottoms and similar tops;
- Murphy's bottom and saucer;
- flat tops;
- head and shoulders model.
If a pattern appears in the middle of a trend during a correction period, then the most likely development of events is an exit from the consolidation state in the direction of the current trend.

Bullish rectangle and rising wedge on the Bitcoin chart.
In most cases, this is in the nature of a sharp price jump along the trend, that is, such models, which are trend continuation figures, play the role of unique impulse indicators. Continuation models include:
- corrective wedges;
- rectangles;
- wedge-shaped pennants.
It is quite natural that such patterns manifest themselves best on charts of large time frames, so you should look for them on periods of one day and older. But intraday trading with them will become a more complex and risky undertaking.
Indicator-free trading system using Fibonacci levels
Since Fibonacci levels, built into most trading platforms for trading, including the MT4 terminal, are not a technical indicator in the proper sense of the word, trading with them can easily be classified as trading strategies without indicators.
It is enough to plot these levels on the chart of any financial trading asset to immediately understand that they are a tool that describes the price range of any trend movement, expressed as a percentage of the price change from the initial value in Fibonacci numbers.
Nuance! Price movement in a trend is completely subject to the law of the golden ratio.
Fibo levels are graphically represented as horizontal lines of support and resistance. They are also zones of price consolidation and levels of corrections to the main trend, so based on them it is easy to create an absolutely successful indicator-free Forex strategy for trading. Moreover, in comparison with the strategies described above, Fibonacci trading is characterized by maximum visibility and profitability.

An example of trading using this strategy on the AUD/USD chart.
For practical trading using Fibonacci levels, you should expand the Fibonacci grid from one of the local extremes in the direction of the trend. Then the chart will show horizontal lines that are the most significant Fibo levels. These are the level lines:
- 23,6%;
- 38.2%;
- 50,0%;
- 61.8%.
The greatest importance is attached to these levels because they are areas of accumulation of market orders, zones of resistance and support, and lines of breakouts or corrective pullbacks. You should pay attention to the following points:
- The 23.6% level is the first target for price movement after the trend reversal. Here we should expect either continued movement along the trend or a corrective rebound, the probability of which is approximately 50%.
- If the correction does not take place, then the level of 23.6% will be broken towards the value of 38.2%.
- If the price does not break through it and does not go higher, then a correction occurs to the 23.6% level, the probability of which will be higher if there was no rebound from the 23.6% level.
- 50.0% is the level of half the price range. Overcoming it and moving towards 61.8% means the trend is entering the maturity phase. Overcoming the resistance zone by 61.8% means the trend has entered its final, final phase.
- After reaching 100% of the price range, we should expect a trend reversal to the opposite.
You should trade by levels on daily and weekly time intervals, choosing for this pairs with medium and high volatility of about two hundred to seven hundred points, such as the GBP/USD pair.
About trading by volume

Some novice traders try to find profitable trading strategies that do not exist in nature without indicators based on analysis of price volumes.
They should know that due to the absence of a geographical link between the Forex market and a specific local exchange trading platform and round-the-clock trading operations from Monday to Friday, the concept of market volume on Forex does not exist, but there is only the possibility of considering tick volume, which is a simplified indicator of the number of transactions , committed per unit of time.
Therefore, an attempt to build a trading system based on volume indicators, with or without indicators, is simply devoid of practical meaning and is doomed to failure.
Profitability of trading without indicators
The price is primary. Best analytical technical tools will always be only its derivatives. Traders who trade using computer indicators are always faced with either lagging or leading prices of their signals.
Lag means demonstrating events that have already occurred; leading, although it predicts future price movements, does so with many false signals. Therefore, any mathematical indicators are only auxiliary tools, and objective information about price movement can only be obtained from a pure chart. Real professionals only trade this chart!